
In this post I will show you how to configure Grafana and add your new server configured in the previouse post, to start monitoring them.
Steps to Deploy your new server in your Grafana instance.
Data Source
To add a new server to your Grafana dashboard, I will assume you did everything I explain in the 2 previouse post.
No inside Grafana you should go to “Menu > Connections > Data sources”, in your system you should have your first server, where Grafana is installed. In the image below you can see I already have some Prometheus instances runing in my Grafana.
Now let’s add your new server.
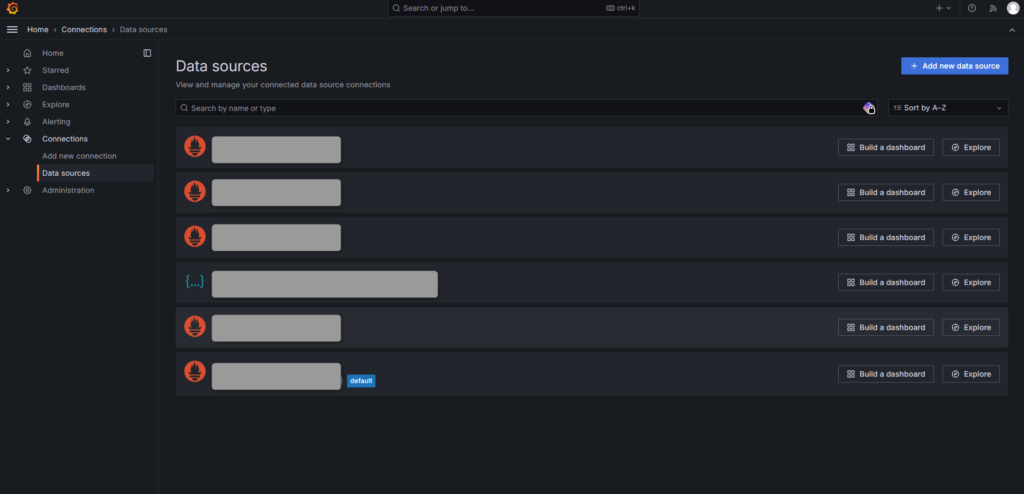
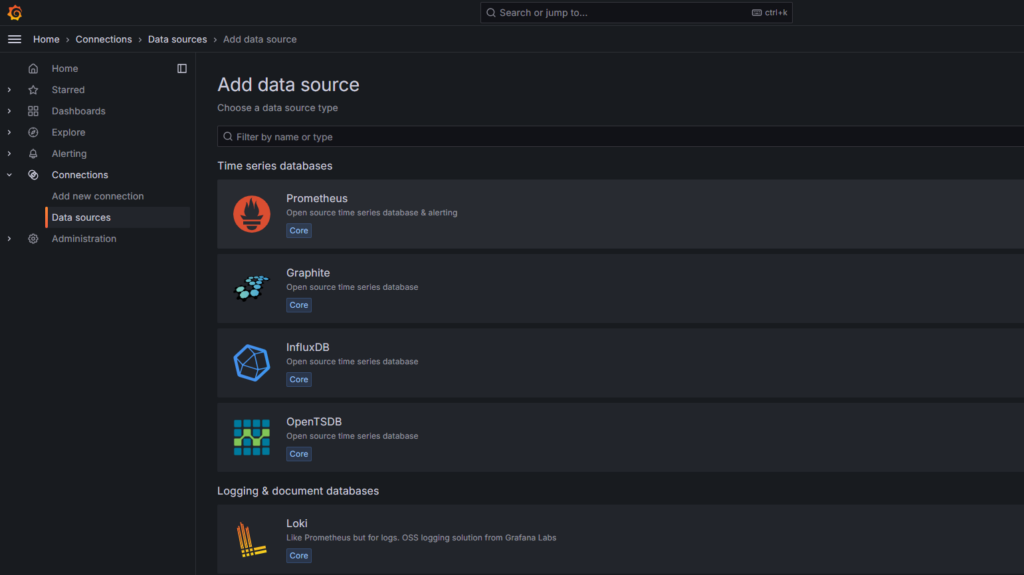
Click in the top right corner blue button “Add new data source”, a list like the one below will show up. In here you can select your data source, were your data comes from. In this example we will select the first option, “Prometheus”
Now you can give your new data source it’s name, I use the name of my server. You will also enter your server IP Address folowed by the port number ‘9090’.
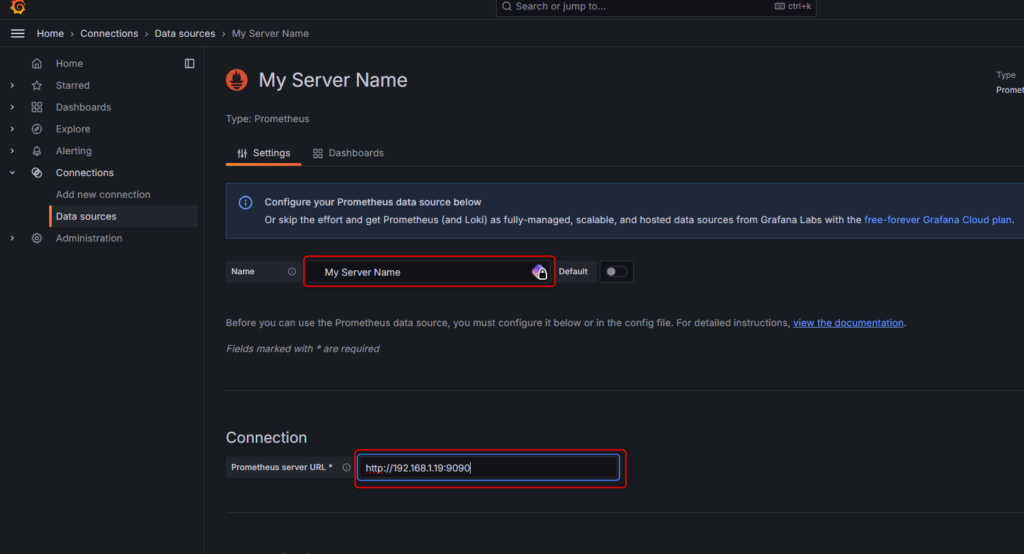
For the rest of this screen you don’t need to change anything, all you have to do is press “Save & Test”
If everything goes according to plan, you should get a message “Sucessfully queired the Prometheus API.”.
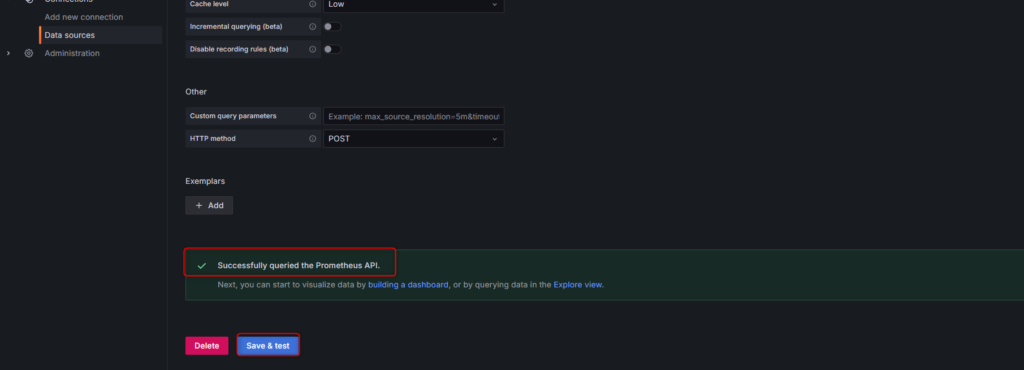
Now you are connected with your new server, all is left to do, is to setup your new dashboard.
Dashboard
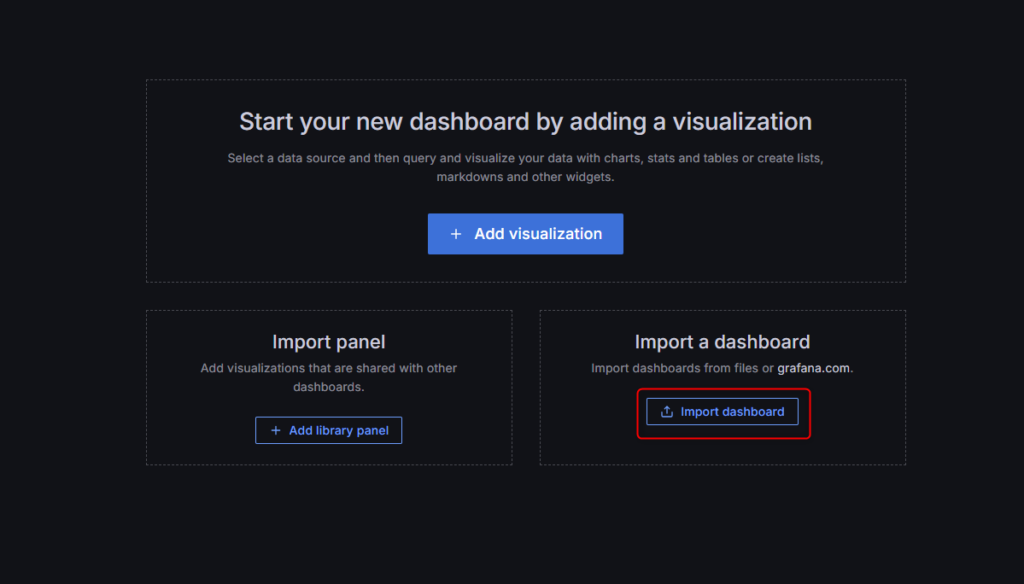
For this you should go to your “Dashboards” menu and click “New”

The usual panel for inserting a new dashboard will show up, and like before, we will “Import a dashboard”.
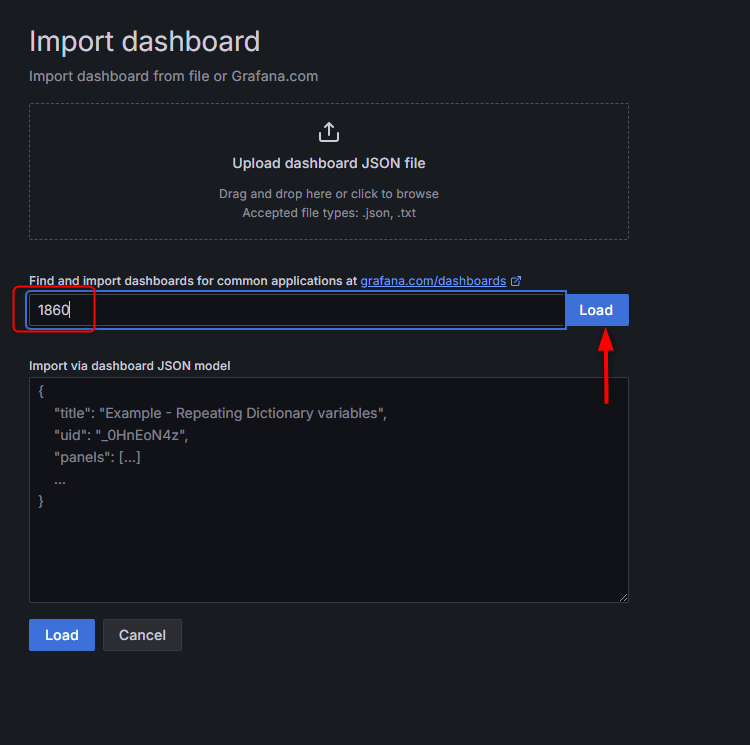
Now we will insert the Grafana dashboard ID that we want to use, like before, we will use the “1860” dashboard and press “Load”
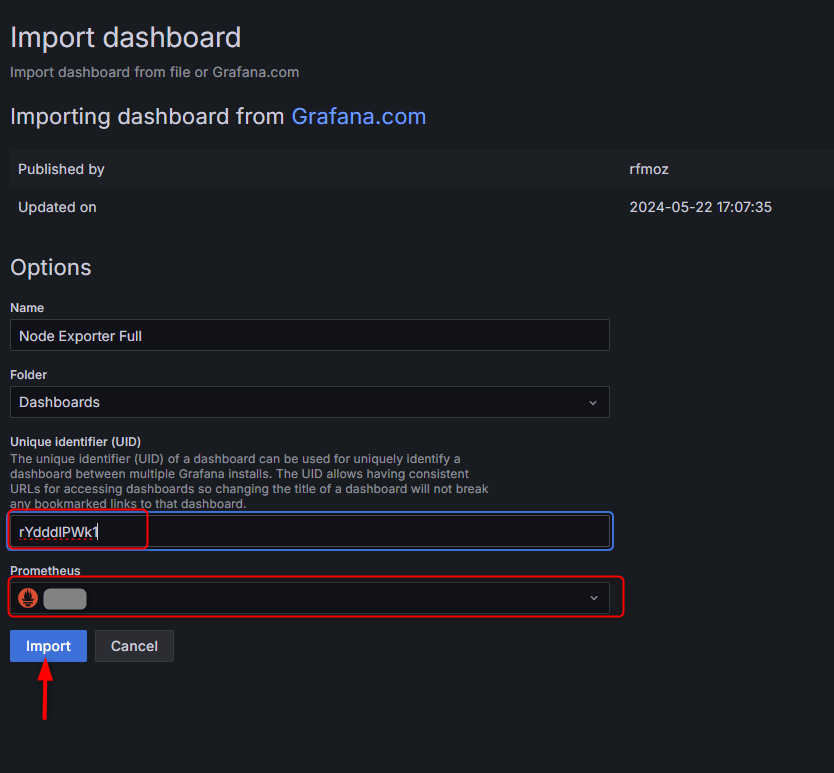
This will take us to the next menu, were we will give our dashboard a name and select our data source, previously created.
Note that the Unique identifier (UID) shows up with an error message, this is because we are already using this dashboard on another server, so we need to give it a diferent UID. In this case click “Change uid” and just add a number or a letter. This will hapean eveytime you add a new dashboard with the same ID. To finish, click “Import”.
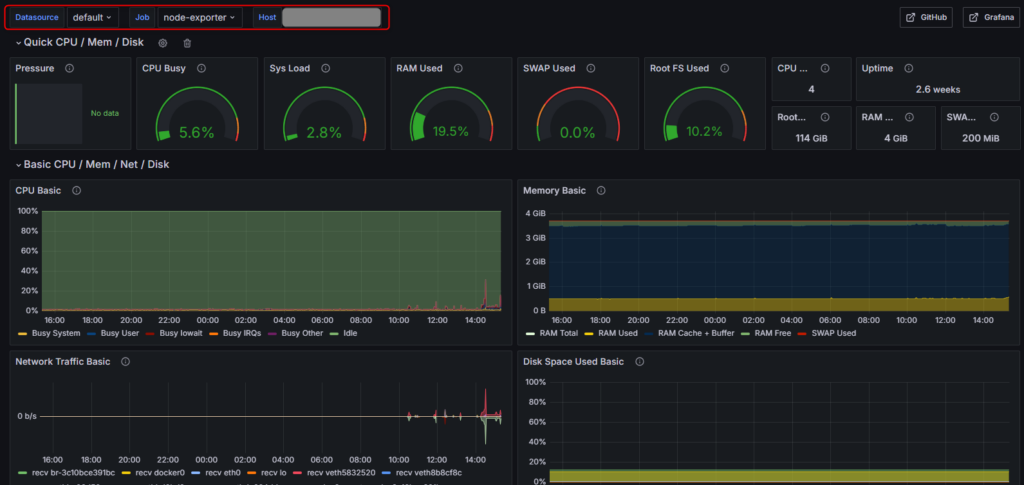
After the you have imported, you will be taken to your new dashboard, like me you will get on top of the dashboard the “Datasource” as default and the “Host” as your Grafana server IP address.
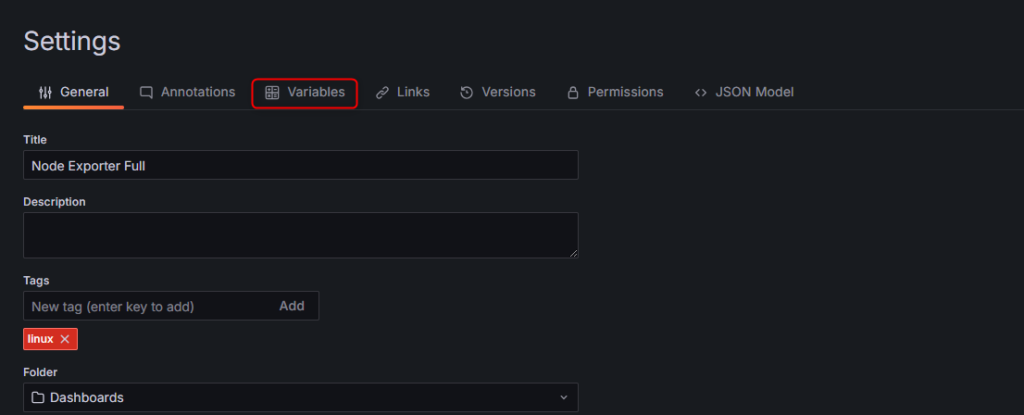
Now we need to configure our node in this new dashboard. For this use should click on the “Dashboard settings” button on top.

In this new menu, you have to goto “Variables”, edit the “node” settings.
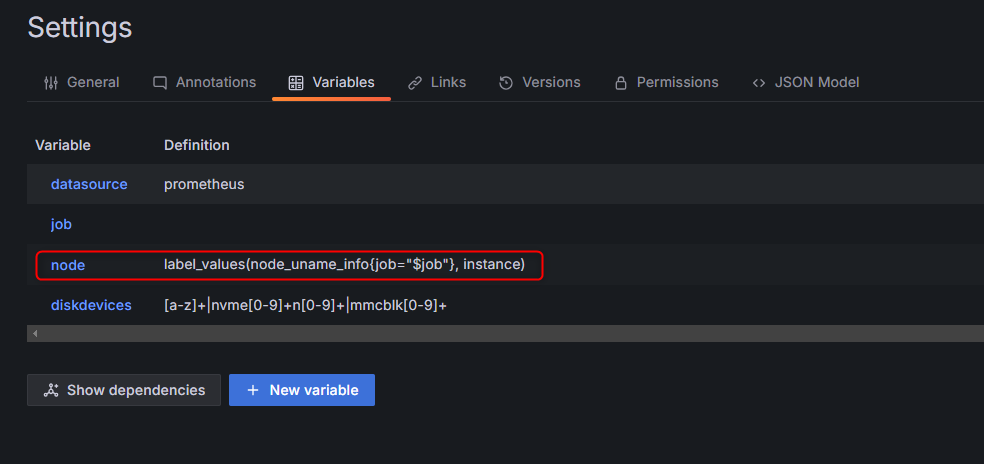
By default this should come as “${datasource}”, you need to select your new data source, that we created at the begining of this post.
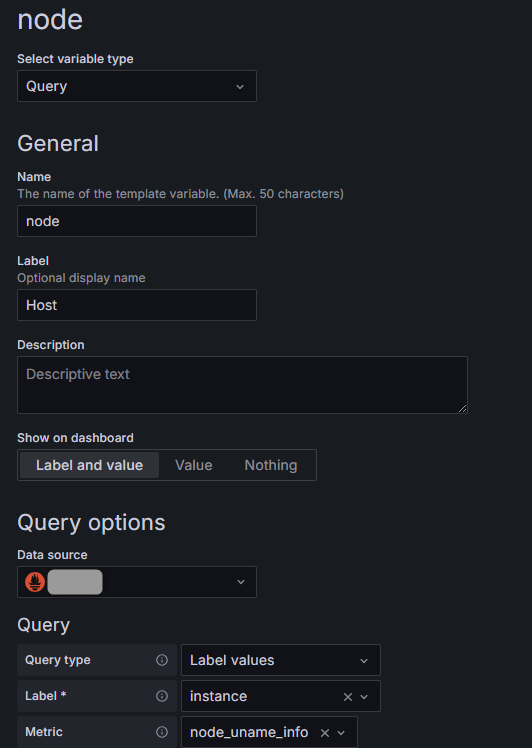
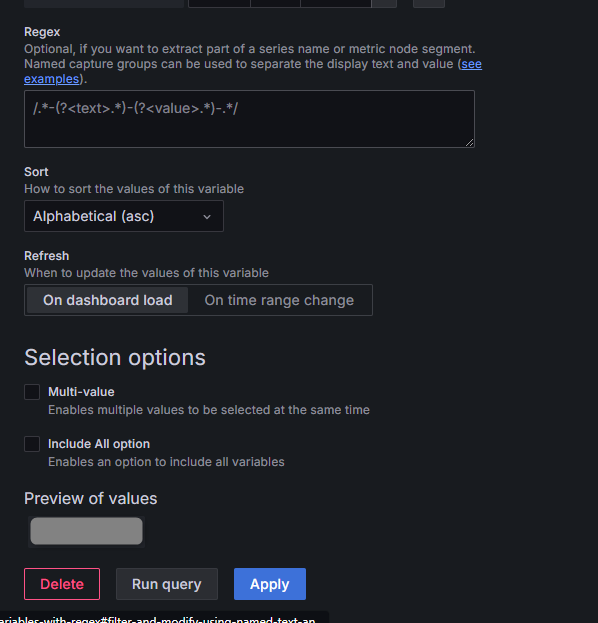
We don’t need to change anything else in this menu, all we need to do new is to click “Run query” and then “Apply” the changes.
For the final step, we need to goto “<> JSON Model”, and in the line 68, we need to change the “uid” from “000000001” to “000000002”
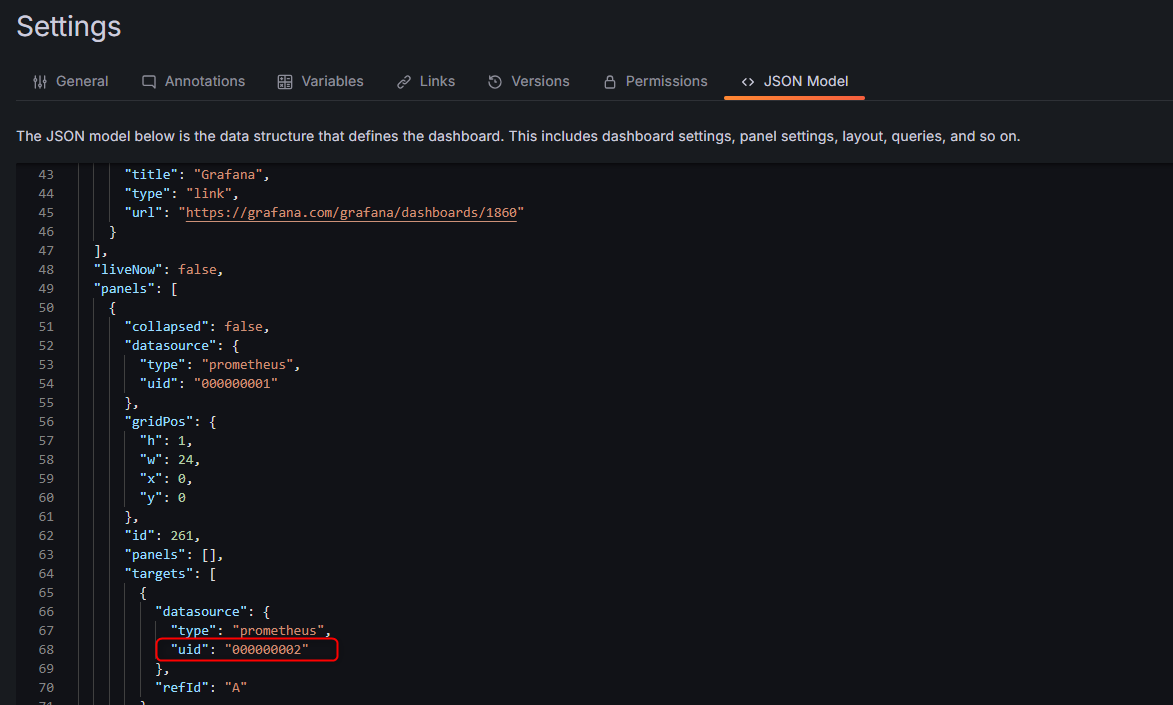
After this change is done all we have to do is to Save our new settings for our new dashboard.
